

Financial analysts often plot the performance of one asset vs. another – they calculate a ratio – when looking for investments with promising potential. One ratio that we have found useful at JAG Capital Management compares the performance of semiconductor equipment firms to semiconductor makers. AMAT is an example of a semiconductor equipment firm while NVDA is a semiconductor maker. To calculate the ratio we use the S&P 1500 Semiconductor Equipment Index and the S&P 1500 Semiconductor Index. If you plot the indexes separately you see they are highly correlated and generally move in the same direction. That’s fine as far as it goes but not much in the way of insight here. However, the ratio between the two reveals a seesaw battle where each industry has periods where it leads and lags. Now this is useful information.
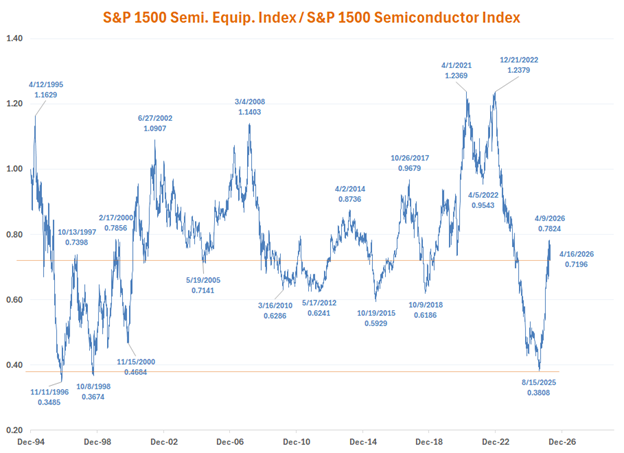
The chart below shows the ratio of these two indexes beginning on 12/30/1994. The main takeaway is that while stocks in these industries move in the same direction, there are clearly times when it pays to favor one over another in your portfolio. A simple way to profit from this insight is to adjust your exposure when the ratio reaches an extreme as it has on multiple occasions over the last three decades.
Referring to the chart, I’d like to highlight two recent ratio extremes from 12/21/2022 and 8/15/2025. On 12/21/2022 the ratio reached its highest level ever meaning the S&P 1500 Semiconductor Equipment Index had outperformed the S&P 1500 Semiconductor Index in an historic way. While both indexes had risen, the equipment makers were clearly outperforming. However, when relationships are cyclical, as this one is, extremes are best treated as reversals as this one turned out to be.
Between 12/21/2022 and 8/15/2025 the semi equipment index rose at an annualized rate of 14.2%, not terrible, but not great when the semiconductor index gained 78.2% annualized over the same period. Investors who favored semi makers over equipment suppliers were handsomely rewarded. That brings us to our most recent inflection point which occurred last summer on 8/15/2025. This time the setup favored semiconductor equipment makers over semiconductor firms and once again a highly profitable opportunity was at hand. While this trade is ongoing as I write between 8/15/2025 and 4/16/2026 the S&P 1500 Semiconductor Equipment Index has risen 135.5% vs. a gain of 24.6% for the S&P 1500 Semiconductor Index. Once again investors with knowledge of this relationship were handsomely rewarded.
Comparing investment opportunities as a simple ratio sometimes reveals opportunities that might otherwise be missed.
Source: FactSet, JAG Capital Management
Important Disclosure:
JAG Capital Management, LLC (“JAG” or “Firm”) is a Missouri company and a wholly owned subsidiary of J.A. Glynn & Co., registered (not implying a certain level of skill or training) as an Investment Advisor with the Securities and Exchange Commission under the Investment Advisors Act of 1940, as amended. Please refer to the Firm’s Form ADV 2A Brochure for more information about the Firm, services and fees on file with the SEC, www.adviserinfo.sec.gov. Firm CRD #159227. You may also contact us at 314.997.1277 or visit our website at www.jagcap.com. Past performance is not to be considered indicative of future performance. Any investment contains risk including the risk of total loss. There is no assurance that the objectives or strategies offered by the Firm will be achieved or successful. Asset allocation and diversification do not guarantee a profit or protect against a loss.
Reference to any particular security is not a recommendation to buy or sell such security. Past performance is not to be considered indicative of future performance. Any investment contains risk including the risk of total loss. There is no assurance that the objectives of strategies offered by the firm will be achieved or successful. Asset allocation and diversification do not guarantee a profit or protect against a loss.