Firm Highlights
Living Our Values: Chrissy Prinster
Congratulations to Chrissy Prinster, honored this quarter for embodying JAG’s Collaborative core value. Since joining JAG as a Client Service Coordinator in 2024, Chrissy has grown into a valued member of our team. She seamlessly handles client service responsibilities, improves and documents cross-department workflows, and collaborates daily with her colleagues to make JAG a better place.
Welcome: Jessica Binkley, FPQP
We are pleased to welcome Jessica Binkley, who joined JAG in June as a Client Service Coordinator. Jessica has been in the investment industry since 2022. She is a graduate of the University of North Carolina at Charlotte. Jessica is a Financial Paraplanner Qualified Professional and enjoys golf, hiking, and following Penn State University football. |
“Bull markets are born on pessimism, grow on skepticism, mature on optimism, and die on euphoria.”
— Sir John Templeton
The conflict between the United States and Israel against Iran began in late February, kicking off a cascade of worries. Chief among these was the near-total closure of the Strait of Hormuz, through which roughly a fifth of the world’s seaborne oil passed before the war. Crude oil prices surged and headline inflation ticked up.
The path to a potential resolution has been far from linear. A fragile ceasefire in early April gave way to weeks of stalled negotiations and intermittent strikes, with the status of Hormuz the central sticking point. In mid-June, US and Iranian negotiators reached a framework agreement to end the fighting and reopen the Strait. Oil completed its own round trip, with West Texas Intermediate crude falling back below $70/barrel – down roughly 40% from its wartime high above $114 – after the announcement of the Memorandum of Understanding between the combatants. We will leave geopolitical analysis to the experts, but we do note that the markets appear to prefer the handshake to the alternatives.
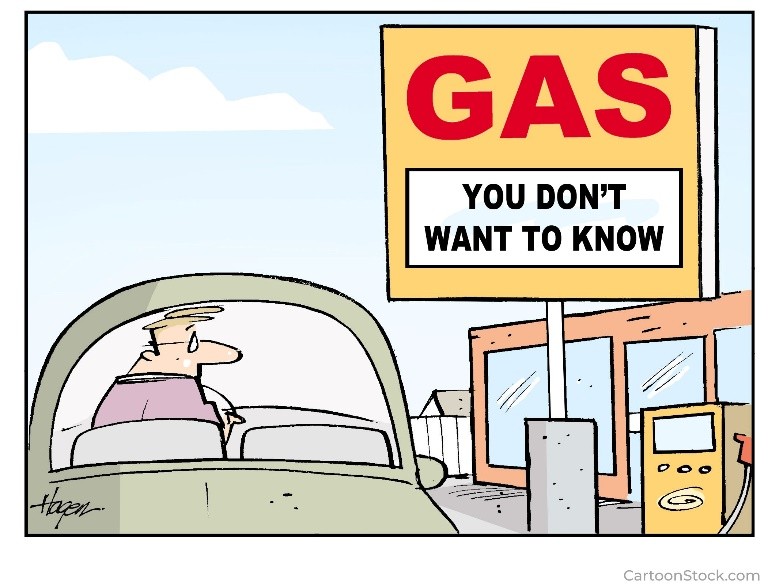
The tentative de-escalation removed a meaningful tail risk and could allow the disinflation process to resume. The caveat is that the security of shipping through Hormuz remains an open question, and the path of energy prices from here is unlikely to be smooth.
To put it mildly, May’s inflation report raised some eyebrows. Headline consumer price inflation rose to 4.2% over the prior year, its highest reading since April 2023 and accelerating month-over-month. While alarming on its face, a potentially calmer picture emerges. Core inflation, which strips out volatile food and energy prices and which the Fed watches most closely, rose just 0.2% on the month and 2.9% over the year. Energy accounted for more than 60% of the entire monthly increase, with gasoline alone jumping roughly 7%. In other words, the heat was almost entirely a war-and-oil story, rather than evidence of broad-based domestic inflation. That said, inflation continues to nag consumers and policymakers. The Personal Consumption Expenditures (PCE) Index – which is the preferred inflation gauge of the Fed – has been running above an annualized 3% over the past one, three, six, and twelve months. Similarly, May producer prices firmed even after stripping out energy costs. This is exactly the sort of muddy picture that will keep the Fed on its toes.
Households are feeling the pinch. Average hourly earnings rose 3.4% over the year through May, implying the typical worker’s purchasing power slipped about 0.8%. The question we carry into the second half is whether those elevated energy costs begin to bleed into wages and services more broadly, or whether they fade if and when the ceasefire holds.
Kevin Warsh made his debut as Chairman at the Fed’s June meeting, and the message tilted hawkish. As expected, the Fed held its policy rate steady at a target range of 3.50% to 3.75%, but its updated projections for year-end Fed Funds rose to 3.8%, up from 3.4% in March. Roughly half of the Federal Open Market Committee is now penciling in at least one rate hike this year. Expectations for rate cuts were pushed into 2027 and beyond.
The market has moved even faster than the committee. Bespoke Investment Group calculated that pricing for the year-end policy rate had risen roughly 100 basis points since February, the equivalent of four additional hikes, accompanied by rising real yields, falling market-implied inflation expectations, a flatter curve, a firmer dollar, and a sell-off in gold. These all signal a potential tightening of rate policy, which could tamp down economic growth as we head into 2027.
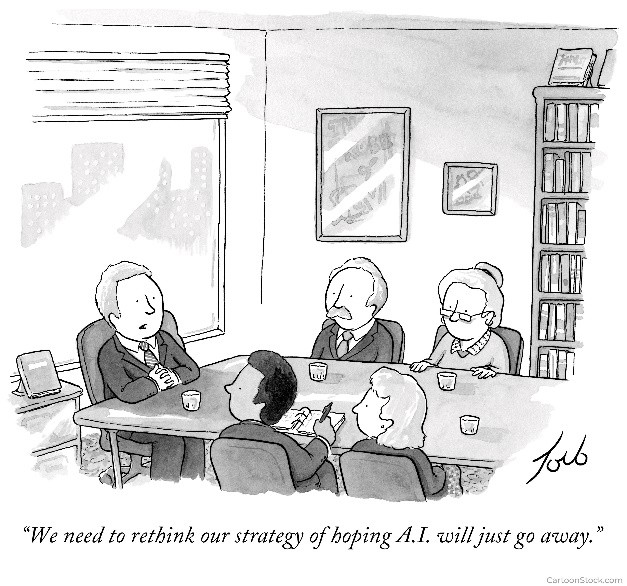
As has been the case for most of the past several years, the Artificial Intelligence (AI) boom continues to be a key driver for markets and economic growth. The standout moves of the quarter were concentrated in market segments related to the AI build-out, led by semiconductors and semiconductor equipment. The risk-on tone even reopened the Initial Public Offering (IPO) capital-markets window that had been shut for the better part of two years. SpaceX (SPCX) completed the largest initial public offering in history in June, and long-dormant deal activity began to stir.
The trillion-dollar question is whether the AI boom is a durable investment super cycle or a bubble destined to pop. No one knows for certain, but we tend to look at history for some clues. Oftentimes, history “rhymes” rather than repeats itself. In our opinion, AI investments now rhyme with the magnitude of the buildout of the railroad system in the 19th century, which peaked at roughly 3% of US GDP. Consensus expectations are for spending to continue to march on into 2027 and beyond, but experts vary widely in their projections.
Figure 1. AI capex as a share of US GDP, by estimate definition.
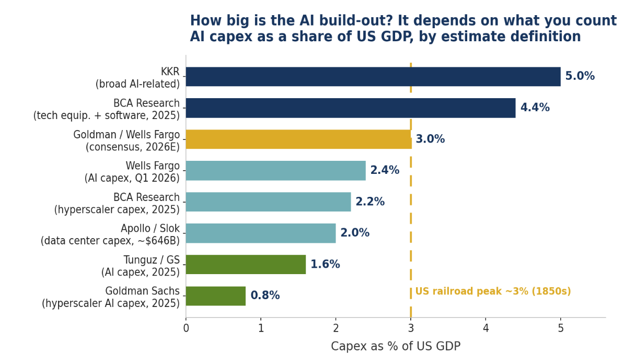
Sources: Goldman Sachs (Dec 2025); T. Tunguz citing GS (Dec 2025); BCA Research (Dec 2025); Apollo / T. Slok (Feb 2026); Wells Fargo / C. Kwon (May 2026); KKR (Nov 2025). Railroad reference: Wells Fargo / C. Kwon (May 2026); R. Pereira, William & Mary (1828–1860). Figures use differing bases; not strictly comparable.
Figure 2. Peak direct sector investment as a share of GDP, like-for-like across eras.
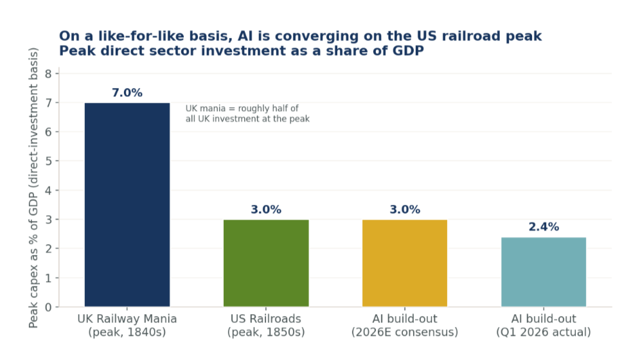
Sources: UK mania: FocusEconomics / A. Odlyzko (Nov 2025). US railroads: Wells Fargo / C. Kwon (May 2026); R. Pereira, William & Mary (2.9% of GDP, 1828–1860). AI: Wells Fargo / C. Kwon (May 2026); Goldman Sachs (Dec 2025). Note: broader definitions put AI at 4–5% of GDP and US railroads at 15–20% of total national investment (a different denominator).
The railroad build-out ended up being tremendous for the economy but terrible for many of the operators and investors who financed it. The rails were genuinely transformative for the United States. They reshaped commerce, pricing of goods, and the geography of American industry, even as wave after wave of railroad operators went bankrupt. Economic historians still debate exactly how indispensable the network was to aggregate growth, but the lesson for investors is the one that survives the debate. The infrastructure endured and paid off for the broader economy even as it wiped out much of the capital that built it. Leverage appears to be part of the explanation for this apparent disconnect Railroads were generally debt-financed, which magnified the impact of operational missteps or economic slowdowns. Thus far, the AI boom has been funded mostly by cash and equity offerings – although this may be beginning to change. Today’s AI builders have begun borrowing to keep pace. The five largest hyperscalers issued roughly $121 billion of US corporate bonds in 2025, versus an average of about $28 billion per year over the prior five years, roughly a 4.3-fold step-change. Forecasters expect issuance to climb further still, with one Wall Street estimate for hyperscaler issuance this year to grow to around $175 billion. (These are third-party forecasts from named sell-side and buy-side research, not JAG estimates or projections.)
Figure 3. Big Five hyperscaler US bond issuance: the 2020–2024 average versus 2025 actual versus the 2026 forecast.
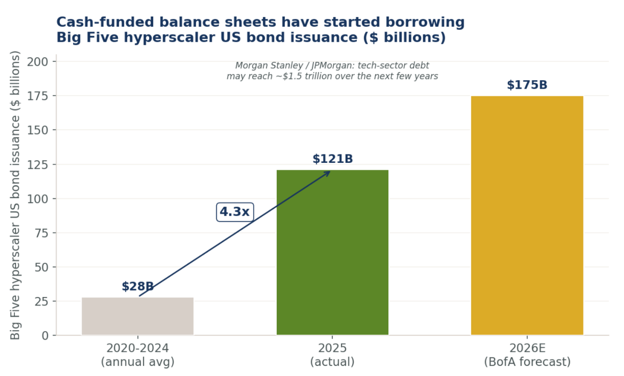
Sources: BofA Securities via Reuters and Mellon Investments (Dec 2025); BofA Global Research 2026 forecast (Mar 2026). Big Five = Amazon, Microsoft, Alphabet, Meta, Oracle. 2020–2024 average issuance was ~$28B per year. Annotation (Morgan Stanley / JPMorgan): tech-sector debt may reach ~$1.5 trillion over the next few years.
The financing posture across AI companies is bifurcating sharply. While some are funding their investments comfortably from their own operating cash flows, others are leaning heavily on debt and equity markets to bridge the gap. We think our job will be to keep drawing the distinction between the companies that profit from the build out versus those that are overextending themselves.
Market Outlook
We remain cautiously optimistic in our outlook. Oil remains a swing factor for the inflation outlook. Given the ongoing disruption in the Middle East, we think it is more likely than not that headline inflation stays elevated for a time while core inflation remains comparatively contained. The risk is that higher-for-longer energy costs begin to bleed into wages and services, which would change the conversation quickly. In the meantime, we are positioned for a central bank that is in no hurry to ease.
We remain quite confident that AI will be transformative for the economy and the markets over the next few years, but we are watching leverage levels closely. In our experience, excess leverage often lurks at the scene of broader market or economic downturns.
In our many years navigating markets, we have learned that the quarters that feel most harrowing in real time often turn out to be ones that most reward discipline and patience. In our view, the second quarter was a great example of this. A war, an inflation scare, and a hawkish turn at the Fed would seem to be more than enough to derail markets. Instead, resilient earnings and a genuine technological transformation carried the major indices to new highs, even as plenty of risks remain firmly on the table.
We are grateful for the trust you place in us to navigate these markets on your behalf. We wish you and yours a safe, healthy, and happy summer!
Warmest regards,

Norm Conley
CEO, Chief Investment Officer & Portfolio Manager
View Full Commentary as PDF
Disclosures
These comments were prepared by the staff of JAG Capital Management, LLC, an SEC-registered investment adviser. The information herein was obtained from various sources including but not limited to FactSet, Bloomberg, Reuters, Standard & Poor’s, Claude, ChatGPT, and the United States Bureau of Labor Statistics, and believed to be reliable; however, we do not guarantee its accuracy or completeness. The information in this report is given as of the date indicated. We assume no obligation to update this information, or to advise on further developments relating to markets, trends, or securities discussed in this report. Opinions expressed are those of the adviser listed above as of the date of this report and are subject to change without notice. Opinions of individual representatives may not be those of the Firm. Additional information is available upon request.
The information contained in this document is prepared and circulated for general information only. It does not address specific investment objectives, or the financial situation and the particular needs of any recipient. Investors should not attempt to make investment decisions solely based on the information contained in this communication as it does not offer enough information to make such decisions and may not be suitable for your personal financial circumstances. You should consult with your financial professional prior to making such decisions. For institutional investors: JAG Capital Management, LLC, has a reasonable basis to believe that you are capable of evaluating investment risks independently, both in general and with regard to particular transactions or strategies. For institutions who disagree with this statement, please contact us immediately.
Past performance should not be considered indicative of future performance. Any investment contains risk including the risk of total loss.
This document does not constitute an offer, or an invitation to make an offer, to buy or sell any securities discussed herein. J.A. Glynn & Co., JAG Capital Management, LLC, and its affiliates, directors, officers, employees, employee benefit programs, and discretionary client accounts may have a position in any securities listed herein.
Please let us know if your financial situation or investment objectives have changed, or whether you prefer to place any reasonable restrictions on the management of your account(s) or modify any existing restrictions.
About JAG
JAG Capital Management (JAG) actively invests for institutions and individuals in highly selective, customizable, and nimble equity and fixed income strategies. JAG is a boutique, independent, employee-owned investment management firm in St. Louis.
1610 Des Peres Road, Suite 120
St. Louis, MO 63131

Quarterly Comments Q2 2026: From Hormuz to Handshake
Norm Conley
Firm Highlights
Living Our Values: Chrissy Prinster
Congratulations to Chrissy Prinster, honored this quarter for embodying JAG’s Collaborative core value. Since joining JAG as a Client Service Coordinator in 2024, Chrissy has grown into a valued member of our team. She seamlessly handles client service responsibilities, improves and documents cross-department workflows, and collaborates daily with her colleagues to make JAG a better place.
Welcome: Jessica Binkley, FPQP
We are pleased to welcome Jessica Binkley, who joined JAG in June as a Client Service Coordinator. Jessica has been in the investment industry since 2022. She is a graduate of the University of North Carolina at Charlotte. Jessica is a Financial Paraplanner Qualified Professional and enjoys golf, hiking, and following Penn State University football.
The conflict between the United States and Israel against Iran began in late February, kicking off a cascade of worries. Chief among these was the near-total closure of the Strait of Hormuz, through which roughly a fifth of the world’s seaborne oil passed before the war. Crude oil prices surged and headline inflation ticked up.
The path to a potential resolution has been far from linear. A fragile ceasefire in early April gave way to weeks of stalled negotiations and intermittent strikes, with the status of Hormuz the central sticking point. In mid-June, US and Iranian negotiators reached a framework agreement to end the fighting and reopen the Strait. Oil completed its own round trip, with West Texas Intermediate crude falling back below $70/barrel – down roughly 40% from its wartime high above $114 – after the announcement of the Memorandum of Understanding between the combatants. We will leave geopolitical analysis to the experts, but we do note that the markets appear to prefer the handshake to the alternatives.
The tentative de-escalation removed a meaningful tail risk and could allow the disinflation process to resume. The caveat is that the security of shipping through Hormuz remains an open question, and the path of energy prices from here is unlikely to be smooth.
To put it mildly, May’s inflation report raised some eyebrows. Headline consumer price inflation rose to 4.2% over the prior year, its highest reading since April 2023 and accelerating month-over-month. While alarming on its face, a potentially calmer picture emerges. Core inflation, which strips out volatile food and energy prices and which the Fed watches most closely, rose just 0.2% on the month and 2.9% over the year. Energy accounted for more than 60% of the entire monthly increase, with gasoline alone jumping roughly 7%. In other words, the heat was almost entirely a war-and-oil story, rather than evidence of broad-based domestic inflation. That said, inflation continues to nag consumers and policymakers. The Personal Consumption Expenditures (PCE) Index – which is the preferred inflation gauge of the Fed – has been running above an annualized 3% over the past one, three, six, and twelve months. Similarly, May producer prices firmed even after stripping out energy costs. This is exactly the sort of muddy picture that will keep the Fed on its toes.
Households are feeling the pinch. Average hourly earnings rose 3.4% over the year through May, implying the typical worker’s purchasing power slipped about 0.8%. The question we carry into the second half is whether those elevated energy costs begin to bleed into wages and services more broadly, or whether they fade if and when the ceasefire holds.
Kevin Warsh made his debut as Chairman at the Fed’s June meeting, and the message tilted hawkish. As expected, the Fed held its policy rate steady at a target range of 3.50% to 3.75%, but its updated projections for year-end Fed Funds rose to 3.8%, up from 3.4% in March. Roughly half of the Federal Open Market Committee is now penciling in at least one rate hike this year. Expectations for rate cuts were pushed into 2027 and beyond.
The market has moved even faster than the committee. Bespoke Investment Group calculated that pricing for the year-end policy rate had risen roughly 100 basis points since February, the equivalent of four additional hikes, accompanied by rising real yields, falling market-implied inflation expectations, a flatter curve, a firmer dollar, and a sell-off in gold. These all signal a potential tightening of rate policy, which could tamp down economic growth as we head into 2027.
As has been the case for most of the past several years, the Artificial Intelligence (AI) boom continues to be a key driver for markets and economic growth. The standout moves of the quarter were concentrated in market segments related to the AI build-out, led by semiconductors and semiconductor equipment. The risk-on tone even reopened the Initial Public Offering (IPO) capital-markets window that had been shut for the better part of two years. SpaceX (SPCX) completed the largest initial public offering in history in June, and long-dormant deal activity began to stir.
The trillion-dollar question is whether the AI boom is a durable investment super cycle or a bubble destined to pop. No one knows for certain, but we tend to look at history for some clues. Oftentimes, history “rhymes” rather than repeats itself. In our opinion, AI investments now rhyme with the magnitude of the buildout of the railroad system in the 19th century, which peaked at roughly 3% of US GDP. Consensus expectations are for spending to continue to march on into 2027 and beyond, but experts vary widely in their projections.
Figure 1. AI capex as a share of US GDP, by estimate definition.
Sources: Goldman Sachs (Dec 2025); T. Tunguz citing GS (Dec 2025); BCA Research (Dec 2025); Apollo / T. Slok (Feb 2026); Wells Fargo / C. Kwon (May 2026); KKR (Nov 2025). Railroad reference: Wells Fargo / C. Kwon (May 2026); R. Pereira, William & Mary (1828–1860). Figures use differing bases; not strictly comparable.
Figure 2. Peak direct sector investment as a share of GDP, like-for-like across eras.
Sources: UK mania: FocusEconomics / A. Odlyzko (Nov 2025). US railroads: Wells Fargo / C. Kwon (May 2026); R. Pereira, William & Mary (2.9% of GDP, 1828–1860). AI: Wells Fargo / C. Kwon (May 2026); Goldman Sachs (Dec 2025). Note: broader definitions put AI at 4–5% of GDP and US railroads at 15–20% of total national investment (a different denominator).
The railroad build-out ended up being tremendous for the economy but terrible for many of the operators and investors who financed it. The rails were genuinely transformative for the United States. They reshaped commerce, pricing of goods, and the geography of American industry, even as wave after wave of railroad operators went bankrupt. Economic historians still debate exactly how indispensable the network was to aggregate growth, but the lesson for investors is the one that survives the debate. The infrastructure endured and paid off for the broader economy even as it wiped out much of the capital that built it. Leverage appears to be part of the explanation for this apparent disconnect Railroads were generally debt-financed, which magnified the impact of operational missteps or economic slowdowns. Thus far, the AI boom has been funded mostly by cash and equity offerings – although this may be beginning to change. Today’s AI builders have begun borrowing to keep pace. The five largest hyperscalers issued roughly $121 billion of US corporate bonds in 2025, versus an average of about $28 billion per year over the prior five years, roughly a 4.3-fold step-change. Forecasters expect issuance to climb further still, with one Wall Street estimate for hyperscaler issuance this year to grow to around $175 billion. (These are third-party forecasts from named sell-side and buy-side research, not JAG estimates or projections.)
Figure 3. Big Five hyperscaler US bond issuance: the 2020–2024 average versus 2025 actual versus the 2026 forecast.
Sources: BofA Securities via Reuters and Mellon Investments (Dec 2025); BofA Global Research 2026 forecast (Mar 2026). Big Five = Amazon, Microsoft, Alphabet, Meta, Oracle. 2020–2024 average issuance was ~$28B per year. Annotation (Morgan Stanley / JPMorgan): tech-sector debt may reach ~$1.5 trillion over the next few years.
The financing posture across AI companies is bifurcating sharply. While some are funding their investments comfortably from their own operating cash flows, others are leaning heavily on debt and equity markets to bridge the gap. We think our job will be to keep drawing the distinction between the companies that profit from the build out versus those that are overextending themselves.
Market Outlook
We remain cautiously optimistic in our outlook. Oil remains a swing factor for the inflation outlook. Given the ongoing disruption in the Middle East, we think it is more likely than not that headline inflation stays elevated for a time while core inflation remains comparatively contained. The risk is that higher-for-longer energy costs begin to bleed into wages and services, which would change the conversation quickly. In the meantime, we are positioned for a central bank that is in no hurry to ease.
We remain quite confident that AI will be transformative for the economy and the markets over the next few years, but we are watching leverage levels closely. In our experience, excess leverage often lurks at the scene of broader market or economic downturns.
In our many years navigating markets, we have learned that the quarters that feel most harrowing in real time often turn out to be ones that most reward discipline and patience. In our view, the second quarter was a great example of this. A war, an inflation scare, and a hawkish turn at the Fed would seem to be more than enough to derail markets. Instead, resilient earnings and a genuine technological transformation carried the major indices to new highs, even as plenty of risks remain firmly on the table.
We are grateful for the trust you place in us to navigate these markets on your behalf. We wish you and yours a safe, healthy, and happy summer!
Warmest regards,
Norm Conley
CEO, Chief Investment Officer & Portfolio Manager
View Full Commentary as PDF
Disclosures
These comments were prepared by the staff of JAG Capital Management, LLC, an SEC-registered investment adviser. The information herein was obtained from various sources including but not limited to FactSet, Bloomberg, Reuters, Standard & Poor’s, Claude, ChatGPT, and the United States Bureau of Labor Statistics, and believed to be reliable; however, we do not guarantee its accuracy or completeness. The information in this report is given as of the date indicated. We assume no obligation to update this information, or to advise on further developments relating to markets, trends, or securities discussed in this report. Opinions expressed are those of the adviser listed above as of the date of this report and are subject to change without notice. Opinions of individual representatives may not be those of the Firm. Additional information is available upon request.
The information contained in this document is prepared and circulated for general information only. It does not address specific investment objectives, or the financial situation and the particular needs of any recipient. Investors should not attempt to make investment decisions solely based on the information contained in this communication as it does not offer enough information to make such decisions and may not be suitable for your personal financial circumstances. You should consult with your financial professional prior to making such decisions. For institutional investors: JAG Capital Management, LLC, has a reasonable basis to believe that you are capable of evaluating investment risks independently, both in general and with regard to particular transactions or strategies. For institutions who disagree with this statement, please contact us immediately.
Past performance should not be considered indicative of future performance. Any investment contains risk including the risk of total loss.
This document does not constitute an offer, or an invitation to make an offer, to buy or sell any securities discussed herein. J.A. Glynn & Co., JAG Capital Management, LLC, and its affiliates, directors, officers, employees, employee benefit programs, and discretionary client accounts may have a position in any securities listed herein.
Please let us know if your financial situation or investment objectives have changed, or whether you prefer to place any reasonable restrictions on the management of your account(s) or modify any existing restrictions.
About JAG
JAG Capital Management (JAG) actively invests for institutions and individuals in highly selective, customizable, and nimble equity and fixed income strategies. JAG is a boutique, independent, employee-owned investment management firm in St. Louis.
1610 Des Peres Road, Suite 120
St. Louis, MO 63131