
Not All Bonds Are Created Equal
Our colleagues on the equity team recently made a case for the active 60/40 portfolio as one of the more durable frameworks available to investors. We thought it worth picking up where that piece left off. The equity sleeve speaks for itself, but the fixed income sleeve raises a harder question, one that 2022 left unresolved: can bonds actually be counted on to do their part?
The concern is legitimate. In 2022, bonds and stocks fell together, erasing the diversification benefit that advisors and clients had long treated as axiomatic. Those doubts have lingered, and recent inflation-driven volatility has brought them back to the surface. The answer, though, is more precise than “bonds failed.” What failed, in large part, was duration.
When Stocks and Bonds Move Together
The relationship between stock and bond returns is not fixed. It shifts with the inflation regime and has done so reliably across the past three decades. During periods of low or falling inflation, bonds and stocks tend to move in opposite directions (or at least with low correlation), with bonds rallying as equities sell off. That negative or muted correlation is what makes fixed income useful in a balanced portfolio.
When inflation is the primary driver of market stress, the relationship changes. Rising inflation fears push rates higher, which hurts bonds, while simultaneously pressuring equity valuations. The two fall together. This is not a new phenomenon. It re-emerged with force in 2022, and the oil-shock-driven volatility in early 2026 offered a fresher reminder.
Exhibit 1: Stock-bond correlation and inflation regimes
Rolling 12-month correlation, US equities vs. Bloomberg US Intermediate Gov/Credit Index (upper); CPI YoY % (lower). Colored line segments correspond with monthly CPI readings below 2%.
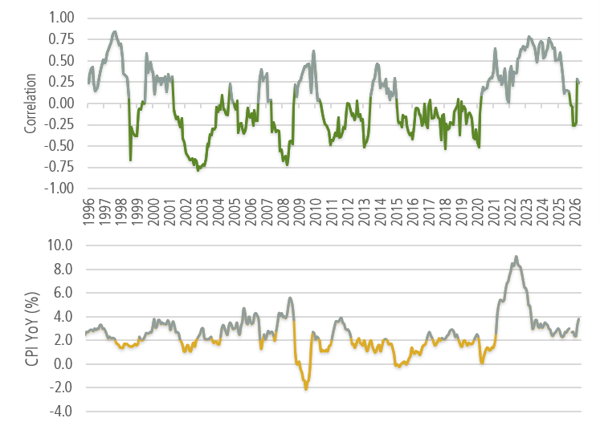
Source: Bloomberg, JAG Capital Management
Prior elevated-correlation episodes resolved as inflation moderated. The current environment has historical precedent, and the correlation has not remained positive indefinitely.
Duration Is the Mechanism
Understanding why some bonds held up better than others in 2022 requires isolating duration. Duration measures a bond’s price sensitivity to interest rate changes: the higher the duration, the larger the price decline for a given rise in rates. In an environment where rates rose sharply, long-duration bonds bore the brunt of the damage.
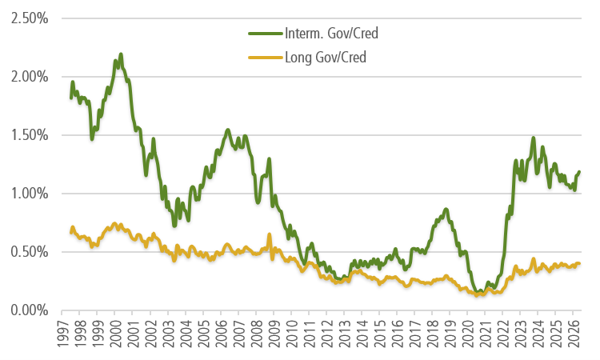
The Bloomberg US Long Government/Credit Index carries roughly twice the duration of the Bloomberg US Intermediate Government/Credit Index. That structural difference is not a minor detail. It is the primary reason intermediate bonds behaved differently when rates rose.
Exhibit 2: Effective duration by index
Bloomberg US Intermediate Gov/Credit vs. Long Gov/Credit, years.

Source: Bloomberg, JAG Capital Management
A related measure, breakeven yield change (yield divided by duration), translates this difference into practical terms: how much would rates need to rise over the next year before total return turns negative? At current yield levels, the intermediate index’s wider breakeven reflects its favorable risk profile and lower price sensitivity. That cushion matters most precisely when rate volatility is elevated.
Exhibit 2B: Breakeven yield change by index
Yield divided by duration — Bloomberg US Intermediate Gov/Credit vs. Long Gov/Credit (%).
Source: Bloomberg, JAG Capital Management
A More Consistent Track Record
Comparing index returns across major equity stress episodes since 2000 produces a deliberately mixed picture, which is more credible than a one-sided argument. In disinflationary crises, long-duration bonds outperformed intermediate credit. The same rate sensitivity that proved damaging in inflationary environments became an asset during the dot-com period, the financial crisis, and the initial COVID shock, when flight-to-quality drove yields sharply lower.
The picture reversed in 2022 and again in early 2026. Long-duration bonds absorbed the worst of the rate move, while intermediate bonds held up relatively well. It’s worth noting that month-end return data understates the true peak-to-trough experience in both episodes, though the directional story is consistent regardless of how the periods are measured. Allocators running a 60/40 or similar strategy rely on the fixed income to retain purchasing power during severe equity drawdowns, and bond portfolio that falls alongside equities, as long-duration bonds did in 2022, forfeits that option at precisely the wrong moment.
Exhibit 3: Index returns during equity stress episodes
Bloomberg US Intermediate Gov/Credit vs. Long Gov/Credit (total return, %); ΔCPI = YoY rate, period end vs. period start
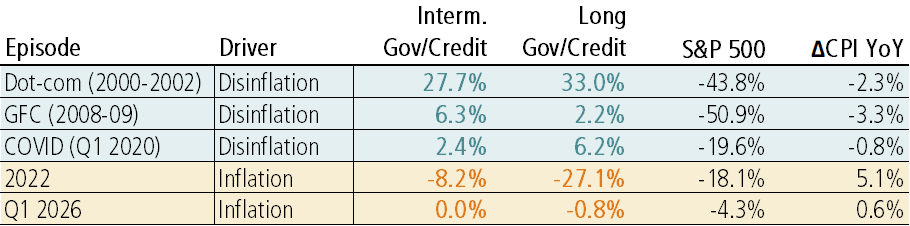
Source: Bloomberg, JAG Capital Management
Starting Yield Matters
The case for intermediate bonds is further supported by current yield levels. Higher starting yields provide a cushion against rising rates or widening spreads. History bears this out: when intermediate government/credit index yields have been at or above current levels, the distribution of subsequent 12-month returns has been both higher and tighter. The income component earns its keep even when price returns are flat or slightly negative.
Long-duration alternatives offer more nominal income but pair it with rate sensitivity that can overwhelm that cushion quickly. At today’s starting yields, the intermediate index’s return profile is more forgiving across the range of scenarios investors are likely to face.
Exhibit 4: Starting yield vs. 12-month forward total return
Bloomberg US Intermediate Gov/Credit Index, monthly observations since 2000
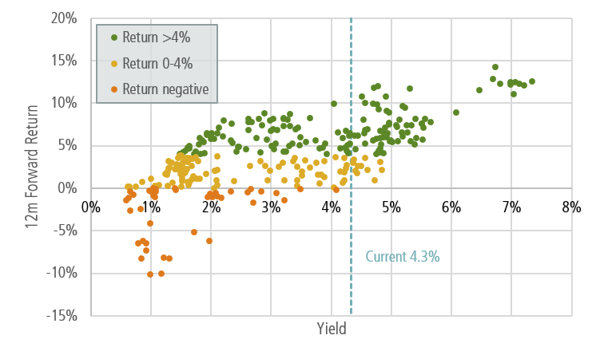
Source: Bloomberg, JAG Capital Management
The 60/40 framework’s diversification benefit is intact, but it depends on what occupies the fixed income sleeve. Intermediate fixed income has demonstrated a more reliable profile across the range of environments investors are likely to face, including the inflationary ones that exposed the limits of longer duration. The bonds that hold up when it counts are not always the ones that reach farthest down the curve.
— JAG’s Fixed Income Research Team
Disclosures
This report was prepared by the staff of JAG Capital Management, LLC, an SEC-registered investment adviser. The information herein was obtained from various sources including but not limited to FactSet, Bloomberg, Reuters, Standard & Poor’s, ChatGPT, and the United States Bureau of Labor Statistics, and believed to be reliable; however, we do not guarantee its accuracy or completeness. The information in this report is given as of the date indicated. We assume no obligation to update this information, or to advise on further developments relating to securities
discussed in this report. The opinions expressed are those of the adviser listed above as of the date of this report and are subject to change without notice. The opinions of individual representatives may not be those of the Firm. Additional information is available upon request.
The information contained in this document is prepared and circulated for general information only. It does not address specific investment objectives, or the financial situation and the particular needs of any recipient. Investors should not attempt to make investment decisions solely based on the information contained in this communication as it does not offer enough information to make such decisions and may not be suitable for your personal financial circumstances. You should consult with your financial professional prior to making such decisions. For institutional investors: JAG Capital Management, LLC, has a reasonable basis to believe that you are capable of evaluating investment risks independently, both in general and with regard to particular
transactions or strategies. For institutions who disagree with this statement, please contact us immediately. Past performance should not be considered indicative of future performance. Any investment contains risk including the risk of total loss.
This document does not constitute an offer, or an invitation to make an offer, to buy or sell any securities discussed herein. J.A. Glynn & Co., JAG Capital Management, LLC, and its affiliates, directors, officers, employees, employee benefit programs and discretionary client accounts may have a position in any securities listed herein.