Firm Highlights
Congratulations to Greg Dunn, whom we honored this quarter for embodying JAG’s Collaborative core value. Since joining the team as a Strategic Relationships Associate in early 2025, Greg has grown into a key contributor. He collaborates daily with clients and our research, operations, and compliance teams to support the long-term growth of JAG. Congratulations and thank you, Greg! |
Market Highlights
- Earnings Continue to Accelerate: FactSet now expects S&P 500 earnings to grow 29.1% year over year in the third quarter, which would mark the third straight quarter of growth above 25%.
- Stocks Edged Higher: The S&P 500 gained 2.3% for the quarter and the Nasdaq Composite 2.6%, while the Dow Jones Industrial Average slipped 2.3% and small-company stocks (as represented by the Russell 2000) fell 7.2%.
- A Tighter Fed: After holding its target range at 3.50–3.75% in July, the Federal Reserve raised it a quarter point to 3.75–4.00% on September 16, its first increase since 2023.
- Yields Reach Two-Decade Highs: The 10-year Treasury yield rose from 4.44% to 5.29% during the quarter, finishing above its 2006 and 2007 peaks.
- Oil Keeps Inflation Sticky: The price of oil rose about 38% during the quarter, and headline consumer prices rose 3.4% over the 12 months through August.
|
“Interest rates are to asset prices sort of like gravity is to the apple.”
– Warren Buffett, 2013 Berkshire Hathaway Annual Meeting
Market Overview
The S&P 500 returned 2.3% last quarter, shrugging off rising interest rates and tighter Fed policy. Energy stocks were the best performing sector. Utilities brought up the rear, and smaller companies lagged badly. The S&P 500 ended the quarter with a total year-to-date return of 12.8%. Bond investors, on the other hand, had a bruising summer. The yield on the 10-year Treasury note climbed from 4.44% at the end of June to 5.29% on September 30, a level not seen in almost two decades. The Federal Reserve also raised short-term rates in September for the first time since 2023.
Conventional wisdom holds that rising rates are negative for stocks, but, at least so far in 2026, that has not been the case. To paraphrase the old saying, “history does not repeat itself, but it does rhyme.” There have been multiple periods in which both stocks and interest rates rose at the same time, including 1954–1959, 1964–1968, 1987, 1999, and 2018. Careful readers will grimace with the memory of 1987. That year the 10-year yield rose from an average of about 7.1% in January to 9.5% in October. The S&P 500 climbed nearly 40% to its August 25 peak anyway, as if stocks and bonds were reading from different scripts. On October 19, remembered ever since as Black Monday, the index fell 20.5%, still its worst single-day loss on record. We think the lesson has less to do with crashes than with patience running out. Stocks can shrug off rising yields for a surprisingly long time, until a valuation or liquidity shock makes the gap impossible to ignore. The year’s ending was far less dramatic. Despite that harrowing autumn, the S&P 500 finished 1987 with a total return of approximately 5%.
The 1950s provide a much more comforting analogy. For generations, investors had insisted that stocks pay a higher dividend yield than bonds, on the logic that riskier assets ought to pay more. In the second quarter of 1958, stocks yielded 3.9% against 2.9% on the 10-year Treasury. Within three months, rising stock prices and falling bond prices had flipped the relationship to 3.3% versus 3.8%. Many on Wall Street warned of overvaluation, but stocks kept climbing for most of the following decade, even as the 10-year yield roughly doubled between 1954 and 1960, because investors came to prize growing earnings over current income. The economist Peter Bernstein, who watched that inversion firsthand, later wrote that it taught him “anything can happen.” Today’s market has its own growth story: FactSet reported that S&P 500 revenue grew 15.0% in the second quarter, the fastest pace since late 2021. FactSet estimates that year-over-year earnings growth will be 29.1% for the third quarter. If that figure proves out once companies finish reporting, it will mark the third consecutive quarter of earnings growth above 25% and the eighth straight quarter of double-digit growth. Generally, Wall Street analysts tend to start out optimistic and then trim their estimates as the months go by. Over the past ten years, FactSet data show analysts’ estimates fall by an average of 2.5% during a given quarter. During the third quarter, however, estimates actually rose 1.3%. Of the 116 S&P 500 companies that issued guidance for the third quarter, 72 (or 62%) raised expectations, well above the 10-year average of 42%.
We find it encouraging that the market has grown less expensive even as it approaches record highs. From June 30 through September 30, the S&P 500’s price rose about 2% while analysts’ forward 12-month earnings estimates rose 9.6%, according to FactSet. As a result, the forward price-to-earnings ratio (the price investors pay for each dollar of expected earnings over the next year) fell from 20.6 to 19.1 and is now below its 5-year average of 20.2.
As is always the case in investing, caveats apply. First, the growth is concentrated in companies which are benefiting from heavy spending on AI. Semiconductor companies are expected to more than double their earnings this quarter, and FactSet notes that the Information Technology sector’s growth rate falls from 63.5% to 24.2% if semiconductors are excluded. Additionally, the bar keeps rising. FactSet consensus calls for earnings growth of 26.8% in the fourth quarter and 15.4% for calendar 2027, but just 1.7% for the second quarter of 2027, when companies will be lapping this year’s exceptional results.
“The plain fact is that inflation is too high and has been for too long.”
-Federal Reserve Chair Kevin Warsh, September 16, 2026
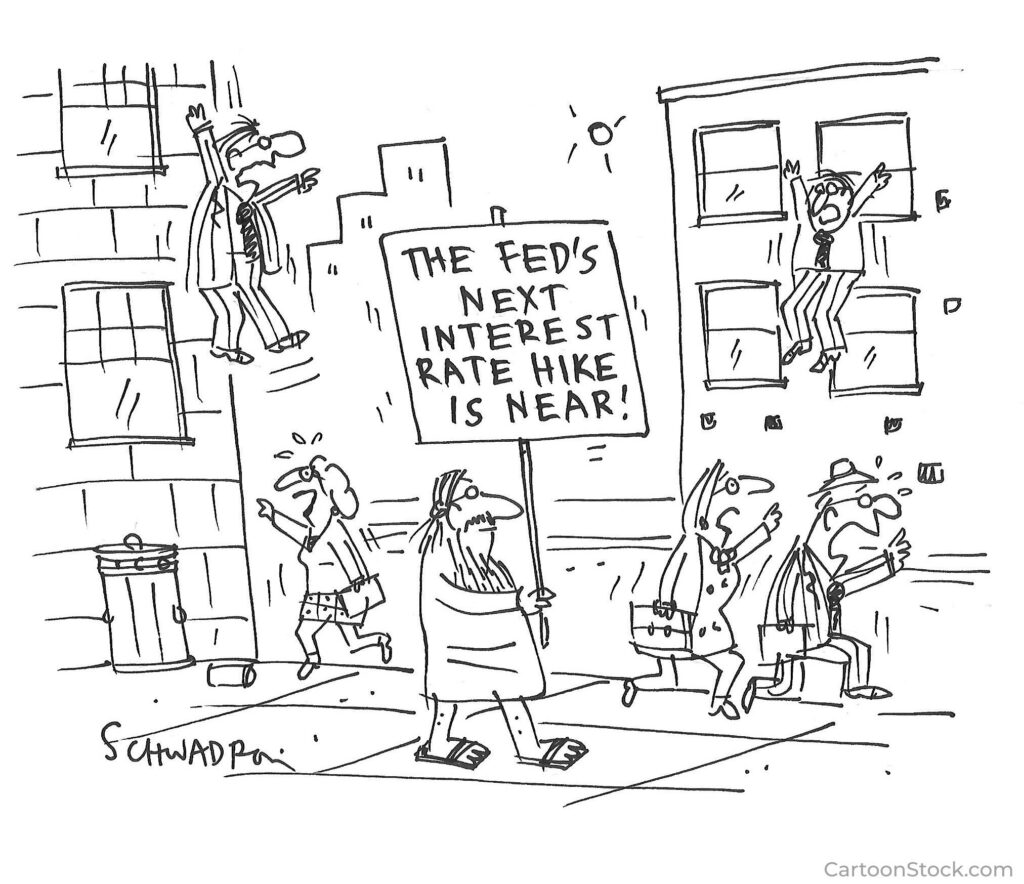
The Federal Reserve changed direction this quarter. At its July meeting, the Federal Open Market Committee (FOMC) held its target range for the federal funds rate at 3.50–3.75%, but three regional Fed presidents (Beth Hammack of Cleveland, Neel Kashkari of Minneapolis, and Lorie Logan of Dallas) dissented in favor of an immediate increase. By September, the rest of the committee had come around. On September 16, the FOMC voted unanimously to raise its target range by a quarter point to 3.75–4.00%, its first increase since 2023.
Chair Warsh, who presided over his first FOMC meeting in June, noted that inflation has run above the Fed’s 2% target for more than five years and said he and his colleagues were hard pressed to describe financial conditions as restrictive. The hike, in his words, removed “a dose of accommodation.” He was equally clear about what he would not do. “I’m not in the forward guidance business,” he told reporters, a departure from recent Fed chairs, who often telegraphed future moves well in advance.
The committee’s own projections offer some clues. In the Summary of Economic Projections (the forecasts Fed officials submit four times a year), 16 of the 18 participants penciled in at least one more increase before year-end, and the median projection puts the federal funds rate at about 4.1% at the end of both 2026 and 2027. Those same projections show inflation, as measured by the Personal Consumption Expenditures (PCE) price index, easing from 3.7% this year to 2.3% next year, but not settling at 2% until 2029.
Monetary policy also carries a political dimension this year. President Trump has repeatedly called for lower interest rates, and those who share his view argue that tighter policy risks slowing the economy. Others see September’s unanimous vote as evidence that the Fed’s independence remains intact. Chair Warsh described independence as “a two-way street,” in which the Fed stays in its lane and lets those who set trade and fiscal policy stay in theirs.
For long-term bond investors, the quarter was a reminder that gravity is not optional. The 10-year Treasury yield climbed eighty-five basis points (0.85 percentage point) during the quarter, and the 30-year yield finished at 5.64%, its highest level in more than two decades.
Chair Warsh offered three explanations for rising rates during his September press conference: a stronger economy; heavy competition for capital as the largest technology companies (the so-called hyperscalers) borrow to fund their data-center buildouts; and geopolitical developments. Higher yields also raise the bar for equities. When a Treasury bond backed by the US government pays more than 5%, investors reasonably expect more from stocks. This partially explains why spectacular earnings growth produced only modest gains in stock prices during the quarter.
The silver lining is that higher yields mean higher income. As of September 30, the Bloomberg US Aggregate Bond Index (the “Agg,” the most widely followed benchmark for high-quality US bonds) yielded 5.56%, up from 4.40% a year earlier, a level unavailable for most of the past two decades. Intermediate-term bonds held up far better than their long-dated cousins. The Bloomberg Intermediate Government/Credit index returned -1.9% for the quarter, compared to the -8.0% drubbing delivered to the long-term Treasury index.
Starting yields matter because they have historically been a reasonable guide to what bonds earn subsequently. A First Citizens Wealth Management study found that since 1989, the Aggregate’s annualized return over a holding period matching its duration (today about six years) has, on average, captured slightly more than its starting yield. There have been painful exceptions, especially for investors who bought bonds when yields were at near-record lows in 2020 and 2021, right before rates moved higher in 2022. But all else being equal, higher yields are generally a good thing for diversified investors with exposure to bonds.
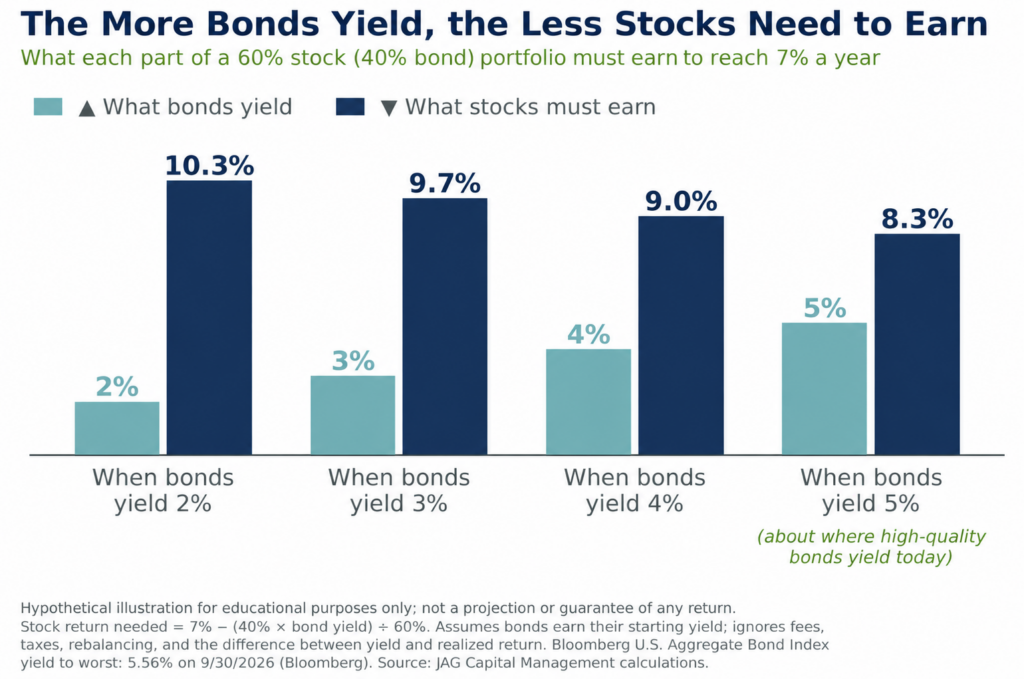
The same arithmetic works in investors’ favor at the portfolio level. As the hypothetical illustration below shows, a portfolio of 60% stocks and 40% bonds seeking a 7% annual return would need stocks to earn about 8.3% a year if bonds yield 5%, compared with about 10.3% if bonds yield 2%. In other words, bonds can carry more of the “load” for portfolios when rates are higher. Investors seem to be noticing. According to Morningstar, taxable-bond funds took in $69 billion in August, their fourth straight month of inflows above $60 billion. This is a streak matched only once before, in 2020. We view today’s yields as more opportunity than threat for long-term fixed-income investors.
Figure 1. Return needed from stocks in a hypothetical 60/40 portfolio seeking 7% a year, at different bond yields.
Note: Hypothetical illustration; see chart footnote for assumptions.
Artificial intelligence remains the engine behind much of the market’s earnings growth. NVIDIA (NVDA) reported revenue of $96.2 billion for its fiscal quarter ending July 26, up 106% from a year earlier, with its Data Center business alone generating $89.0 billion. CEO Jensen Huang declared that AI “has reached its inflection point.”
The profits from the AI buildout are flowing mostly to the largest companies, and that showed up plainly in stock prices this quarter. Smaller companies have far less exposure to the AI windfall and more exposure to rising borrowing costs, since they tend to carry more floating-rate debt; Bank of America has estimated that each additional quarter-point Fed hike trims Russell 2000 operating earnings by about 2%. For the quarter, an index fund tracking the small-cap Russell 2000 fell 7.2% while one tracking the S&P 500 gained 2.3%. That 9.5-point gap was the widest since the first quarter of 2020, according to FactSet data. Even the average S&P 500 stock (as measured by an equal-weighted version of the index) slipped 1.9%, so a relatively small number of very large companies did the heavy lifting.
The setback does come with a potential consolation prize. CFRA’s Sam Stovall estimates that the Russell 2000’s price-to-earnings multiple now sits roughly 34% below its 20-year average. We suspect that discount may draw renewed attention if interest rates stabilize.
As we have discussed multiple times over the past 3+ years, we are enthusiastic long-term believers in AI’s potential to raise productivity and to create attractive opportunities in growth companies. We also remember that transformative technologies and profitable investments are not always the same thing. Isaac Newton, the same man who explained why apples fall, reportedly lost a considerable sum in the South Sea Bubble of 1720. Brilliance does not provide immunity from irrational exuberance. We believe the prudent course is to participate in the AI opportunity with discipline, favoring companies whose earnings are growing into their valuations.
Much of this year’s stubborn inflation can be traced to the gas pump. The conflict involving Iran, which began in late February, continued to constrain oil shipments through the Strait of Hormuz this quarter, and hopes for a negotiated reopening rose and faded more than once. West Texas Intermediate crude climbed from $70.56 a barrel on June 30 to $97.18 at quarter-end, a gain of roughly 38%, after trading as high as $107 during the quarter.
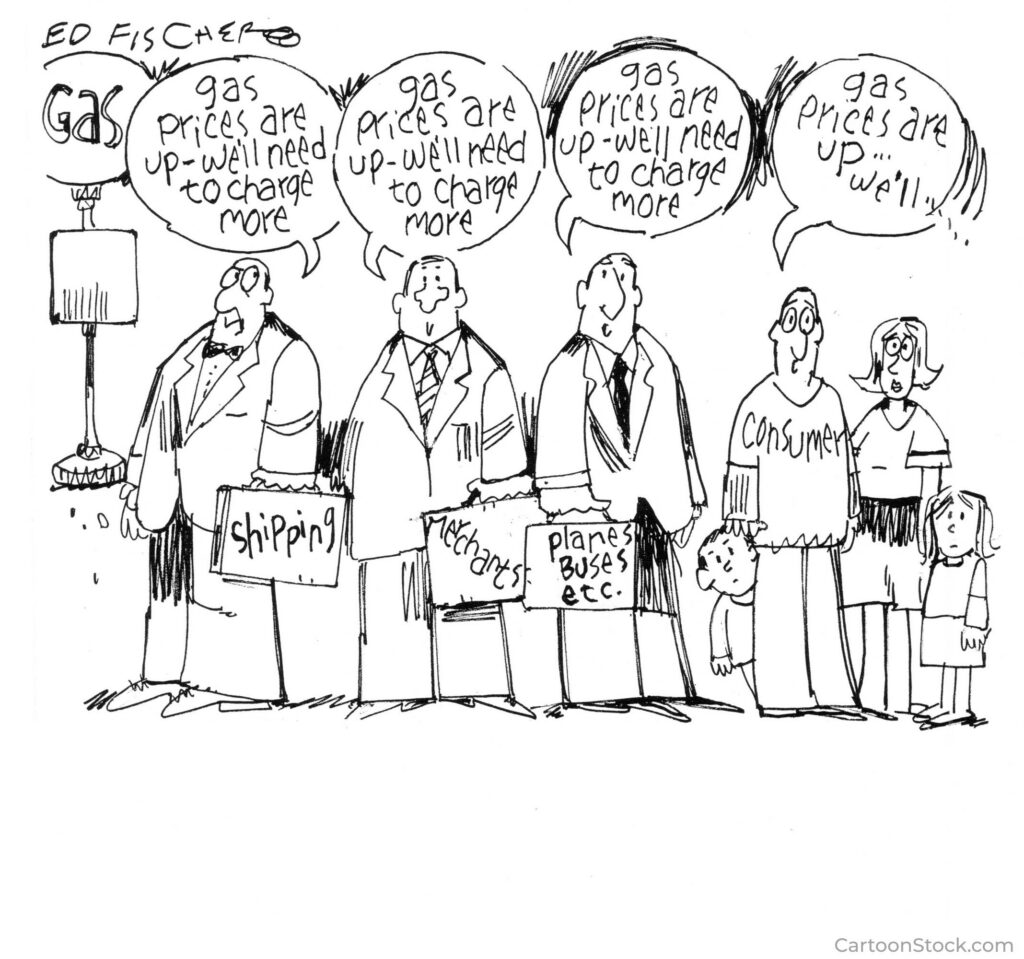
Those costs flow directly into consumer prices. The Consumer Price Index rose 3.4% over the 12 months through August, with the energy component up 16.3%, and gasoline alone accounted for more than a third of August’s monthly increase according to the Bureau of Labor Statistics. The Fed’s preferred gauge tells a similar story. The PCE price index rose 3.4% over the 12 months through August, but only 3.0% once food and energy are stripped out, according to the Bureau of Economic Analysis (BEA). Chair Warsh was candid about the limits of the Fed’s tools. The Fed “cannot affect any individual price, whether it be oil prices,” he said, but it can work to ensure that such price changes “don’t broaden out” into the rest of the economy.
The rest of the economy, meanwhile, keeps surprising on the strong side, with the notable exception of hiring. Nonfarm payrolls rose by just 29,000 in September, after a gain of 133,000 in August, and the unemployment rate ticked up to 4.2%. The BEA also revised second-quarter growth in real gross domestic product (GDP) up to a 2.2% annual rate from 1.5%, with consumer spending and business investment together growing at a 4.6% pace.
The flip side of expensive oil is that one company’s cost is another’s revenue. Energy was the best performing sector in the S&P 500 this quarter. The State Street Energy Select Sector SPDR (XLE) returned almost 16%, and FactSet expects the Energy sector’s third-quarter earnings to more than double from a year ago. Looking ahead, the US Energy Information Administration’s September outlook assumes shipments through Hormuz will gradually increase, with Brent crude averaging about $91 per barrel this year and $74 in 2027. Of course, any forecasts tied to geopolitical events should be viewed skeptically. If oil prices buck expectations and stay elevated, we suspect inflation will prove sticky and the Fed will remain vigilant.
Market Outlook
We see three themes as most likely to shape markets over the coming months.
Earnings versus rates. Third-quarter reporting season begins in earnest in mid-October. With estimates rising rather than falling during the quarter, the hurdle for positive surprises is higher than usual. We think it is more likely than not that earnings remain strong enough to offset much of the pull from higher yields, but we would not be surprised by further volatility if the 10-year yield continues to climb.
The Fed’s next move. The FOMC meets on October 27–28 and again on December 8–9. Fed officials’ own projections point to one more quarter-point increase this year, while Chair Warsh has declined to offer guidance. We suspect the path of energy prices and the broader trend in inflation will matter more to the outcome than any single speech or data point.
Midterm musings. Voters head to the polls on November 3, with control of both chambers of Congress at stake. According to the Schwab Center for Financial Research, the S&P 500 has averaged a price gain of just 1.7% from August 1 through Election Day in midterm years since 1974, followed by average gains of 5.7% over the next three months and 12.4% over the next six months. It is worth noting that the sample size is small (13 elections), and past patterns are no guarantee of the future. That said, we believe it reflects the market’s tendency to react positively to resolution of political uncertainty.
Fourth Quarter Watchlist
| Date |
Event |
Why It Matters |
Possible Market Reaction |
| Oct 14 |
September CPI |
Latest read on consumer inflation ahead of the Fed |
A hot reading could push yields higher |
| Mid-Oct to Nov |
Q3 Earnings Season |
Confirms or challenges FactSet’s 29.1% growth estimate |
Beats may be rewarded less than usual given elevated expectations |
| Oct 27–28 |
FOMC Meeting |
First meeting after September’s hike |
Markets will parse the statement for clues in the absence of forward guidance |
| Nov 3 |
Midterm Elections |
Control of Congress and the policy outlook for 2027 |
Historically, uncertainty has tended to fade once results are known |
Over our 30-plus years in this business, we have learned that investors do best when they respect gravity without being paralyzed by it. Rising profits and rising rates have coexisted before, and we have found that patience and a steady focus on quality serve investors well through such periods. As always, we invest alongside our clients with a long-term mindset. We appreciate the trust you place in JAG, and we wish you and yours a wonderful autumn.
Best,
Norm Conley
CEO, Chief Investment Officer & Portfolio Manager
View Full Commentary as PDF
Disclosures
These comments were prepared by the staff of JAG Capital Management, LLC, an SEC-registered investment adviser. The information herein was obtained from various sources including but not limited to FactSet, Bloomberg, Reuters, Standard & Poor’s, Claude, ChatGPT, and the United States Bureau of Labor Statistics, and believed to be reliable; however, we do not guarantee its accuracy or completeness. The information in this report is given as of the date indicated. We assume no obligation to update this information, or to advise on further developments relating to markets, trends, or securities discussed in this report. Opinions expressed are those of the adviser listed above as of the date of this report and are subject to change without notice. Opinions of individual representatives may not be those of the Firm. Additional information is available upon request.
The information contained in this document is prepared and circulated for general information only. It does not address specific investment objectives, or the financial situation and the particular needs of any recipient. Investors should not attempt to make investment decisions solely based on the information contained in this communication as it does not offer enough information to make such decisions and may not be suitable for your personal financial circumstances. You should consult with your financial professional prior to making such decisions. For institutional investors: JAG Capital Management, LLC, has a reasonable basis to believe that you are capable of evaluating investment risks independently, both in general and with regard to particular transactions or strategies. For institutions who disagree with this statement, please contact us immediately.
Past performance should not be considered indicative of future performance. Any investment contains risk including the risk of total loss.
This document does not constitute an offer, or an invitation to make an offer, to buy or sell any securities discussed herein. J.A. Glynn & Co., JAG Capital Management, LLC, and its affiliates, directors, officers, employees, employee benefit programs, and discretionary client accounts may have a position in any securities listed herein.
Please let us know if your financial situation or investment objectives have changed, or whether you prefer to place any reasonable restrictions on the management of your account(s) or modify any existing restrictions.
About JAG
JAG Capital Management (JAG) actively invests for institutions and individuals in highly selective, customizable, and nimble equity and fixed income strategies. JAG is a boutique, independent, employee-owned investment management firm in St. Louis.
1610 Des Peres Road, Suite 120, St. Louis, MO 63131

Quarterly Comments Q3 2026: Earnings vs. Gravity
Norm Conley
Firm Highlights
Congratulations to Greg Dunn, whom we honored this quarter for embodying JAG’s Collaborative core value. Since joining the team as a Strategic Relationships Associate in early 2025, Greg has grown into a key contributor. He collaborates daily with clients and our research, operations, and compliance teams to support the long-term growth of JAG. Congratulations and thank you, Greg!
Market Highlights
Market Overview
The S&P 500 returned 2.3% last quarter, shrugging off rising interest rates and tighter Fed policy. Energy stocks were the best performing sector. Utilities brought up the rear, and smaller companies lagged badly. The S&P 500 ended the quarter with a total year-to-date return of 12.8%. Bond investors, on the other hand, had a bruising summer. The yield on the 10-year Treasury note climbed from 4.44% at the end of June to 5.29% on September 30, a level not seen in almost two decades. The Federal Reserve also raised short-term rates in September for the first time since 2023.
Conventional wisdom holds that rising rates are negative for stocks, but, at least so far in 2026, that has not been the case. To paraphrase the old saying, “history does not repeat itself, but it does rhyme.” There have been multiple periods in which both stocks and interest rates rose at the same time, including 1954–1959, 1964–1968, 1987, 1999, and 2018. Careful readers will grimace with the memory of 1987. That year the 10-year yield rose from an average of about 7.1% in January to 9.5% in October. The S&P 500 climbed nearly 40% to its August 25 peak anyway, as if stocks and bonds were reading from different scripts. On October 19, remembered ever since as Black Monday, the index fell 20.5%, still its worst single-day loss on record. We think the lesson has less to do with crashes than with patience running out. Stocks can shrug off rising yields for a surprisingly long time, until a valuation or liquidity shock makes the gap impossible to ignore. The year’s ending was far less dramatic. Despite that harrowing autumn, the S&P 500 finished 1987 with a total return of approximately 5%.
The 1950s provide a much more comforting analogy. For generations, investors had insisted that stocks pay a higher dividend yield than bonds, on the logic that riskier assets ought to pay more. In the second quarter of 1958, stocks yielded 3.9% against 2.9% on the 10-year Treasury. Within three months, rising stock prices and falling bond prices had flipped the relationship to 3.3% versus 3.8%. Many on Wall Street warned of overvaluation, but stocks kept climbing for most of the following decade, even as the 10-year yield roughly doubled between 1954 and 1960, because investors came to prize growing earnings over current income. The economist Peter Bernstein, who watched that inversion firsthand, later wrote that it taught him “anything can happen.” Today’s market has its own growth story: FactSet reported that S&P 500 revenue grew 15.0% in the second quarter, the fastest pace since late 2021. FactSet estimates that year-over-year earnings growth will be 29.1% for the third quarter. If that figure proves out once companies finish reporting, it will mark the third consecutive quarter of earnings growth above 25% and the eighth straight quarter of double-digit growth. Generally, Wall Street analysts tend to start out optimistic and then trim their estimates as the months go by. Over the past ten years, FactSet data show analysts’ estimates fall by an average of 2.5% during a given quarter. During the third quarter, however, estimates actually rose 1.3%. Of the 116 S&P 500 companies that issued guidance for the third quarter, 72 (or 62%) raised expectations, well above the 10-year average of 42%.
We find it encouraging that the market has grown less expensive even as it approaches record highs. From June 30 through September 30, the S&P 500’s price rose about 2% while analysts’ forward 12-month earnings estimates rose 9.6%, according to FactSet. As a result, the forward price-to-earnings ratio (the price investors pay for each dollar of expected earnings over the next year) fell from 20.6 to 19.1 and is now below its 5-year average of 20.2.
As is always the case in investing, caveats apply. First, the growth is concentrated in companies which are benefiting from heavy spending on AI. Semiconductor companies are expected to more than double their earnings this quarter, and FactSet notes that the Information Technology sector’s growth rate falls from 63.5% to 24.2% if semiconductors are excluded. Additionally, the bar keeps rising. FactSet consensus calls for earnings growth of 26.8% in the fourth quarter and 15.4% for calendar 2027, but just 1.7% for the second quarter of 2027, when companies will be lapping this year’s exceptional results.
The Federal Reserve changed direction this quarter. At its July meeting, the Federal Open Market Committee (FOMC) held its target range for the federal funds rate at 3.50–3.75%, but three regional Fed presidents (Beth Hammack of Cleveland, Neel Kashkari of Minneapolis, and Lorie Logan of Dallas) dissented in favor of an immediate increase. By September, the rest of the committee had come around. On September 16, the FOMC voted unanimously to raise its target range by a quarter point to 3.75–4.00%, its first increase since 2023.
Chair Warsh, who presided over his first FOMC meeting in June, noted that inflation has run above the Fed’s 2% target for more than five years and said he and his colleagues were hard pressed to describe financial conditions as restrictive. The hike, in his words, removed “a dose of accommodation.” He was equally clear about what he would not do. “I’m not in the forward guidance business,” he told reporters, a departure from recent Fed chairs, who often telegraphed future moves well in advance.
The committee’s own projections offer some clues. In the Summary of Economic Projections (the forecasts Fed officials submit four times a year), 16 of the 18 participants penciled in at least one more increase before year-end, and the median projection puts the federal funds rate at about 4.1% at the end of both 2026 and 2027. Those same projections show inflation, as measured by the Personal Consumption Expenditures (PCE) price index, easing from 3.7% this year to 2.3% next year, but not settling at 2% until 2029.
Monetary policy also carries a political dimension this year. President Trump has repeatedly called for lower interest rates, and those who share his view argue that tighter policy risks slowing the economy. Others see September’s unanimous vote as evidence that the Fed’s independence remains intact. Chair Warsh described independence as “a two-way street,” in which the Fed stays in its lane and lets those who set trade and fiscal policy stay in theirs.
For long-term bond investors, the quarter was a reminder that gravity is not optional. The 10-year Treasury yield climbed eighty-five basis points (0.85 percentage point) during the quarter, and the 30-year yield finished at 5.64%, its highest level in more than two decades.
Chair Warsh offered three explanations for rising rates during his September press conference: a stronger economy; heavy competition for capital as the largest technology companies (the so-called hyperscalers) borrow to fund their data-center buildouts; and geopolitical developments. Higher yields also raise the bar for equities. When a Treasury bond backed by the US government pays more than 5%, investors reasonably expect more from stocks. This partially explains why spectacular earnings growth produced only modest gains in stock prices during the quarter.
The silver lining is that higher yields mean higher income. As of September 30, the Bloomberg US Aggregate Bond Index (the “Agg,” the most widely followed benchmark for high-quality US bonds) yielded 5.56%, up from 4.40% a year earlier, a level unavailable for most of the past two decades. Intermediate-term bonds held up far better than their long-dated cousins. The Bloomberg Intermediate Government/Credit index returned -1.9% for the quarter, compared to the -8.0% drubbing delivered to the long-term Treasury index.
Starting yields matter because they have historically been a reasonable guide to what bonds earn subsequently. A First Citizens Wealth Management study found that since 1989, the Aggregate’s annualized return over a holding period matching its duration (today about six years) has, on average, captured slightly more than its starting yield. There have been painful exceptions, especially for investors who bought bonds when yields were at near-record lows in 2020 and 2021, right before rates moved higher in 2022. But all else being equal, higher yields are generally a good thing for diversified investors with exposure to bonds.
The same arithmetic works in investors’ favor at the portfolio level. As the hypothetical illustration below shows, a portfolio of 60% stocks and 40% bonds seeking a 7% annual return would need stocks to earn about 8.3% a year if bonds yield 5%, compared with about 10.3% if bonds yield 2%. In other words, bonds can carry more of the “load” for portfolios when rates are higher. Investors seem to be noticing. According to Morningstar, taxable-bond funds took in $69 billion in August, their fourth straight month of inflows above $60 billion. This is a streak matched only once before, in 2020. We view today’s yields as more opportunity than threat for long-term fixed-income investors.
Figure 1. Return needed from stocks in a hypothetical 60/40 portfolio seeking 7% a year, at different bond yields.
Note: Hypothetical illustration; see chart footnote for assumptions.
Artificial intelligence remains the engine behind much of the market’s earnings growth. NVIDIA (NVDA) reported revenue of $96.2 billion for its fiscal quarter ending July 26, up 106% from a year earlier, with its Data Center business alone generating $89.0 billion. CEO Jensen Huang declared that AI “has reached its inflection point.”
The profits from the AI buildout are flowing mostly to the largest companies, and that showed up plainly in stock prices this quarter. Smaller companies have far less exposure to the AI windfall and more exposure to rising borrowing costs, since they tend to carry more floating-rate debt; Bank of America has estimated that each additional quarter-point Fed hike trims Russell 2000 operating earnings by about 2%. For the quarter, an index fund tracking the small-cap Russell 2000 fell 7.2% while one tracking the S&P 500 gained 2.3%. That 9.5-point gap was the widest since the first quarter of 2020, according to FactSet data. Even the average S&P 500 stock (as measured by an equal-weighted version of the index) slipped 1.9%, so a relatively small number of very large companies did the heavy lifting.
The setback does come with a potential consolation prize. CFRA’s Sam Stovall estimates that the Russell 2000’s price-to-earnings multiple now sits roughly 34% below its 20-year average. We suspect that discount may draw renewed attention if interest rates stabilize.
As we have discussed multiple times over the past 3+ years, we are enthusiastic long-term believers in AI’s potential to raise productivity and to create attractive opportunities in growth companies. We also remember that transformative technologies and profitable investments are not always the same thing. Isaac Newton, the same man who explained why apples fall, reportedly lost a considerable sum in the South Sea Bubble of 1720. Brilliance does not provide immunity from irrational exuberance. We believe the prudent course is to participate in the AI opportunity with discipline, favoring companies whose earnings are growing into their valuations.
Much of this year’s stubborn inflation can be traced to the gas pump. The conflict involving Iran, which began in late February, continued to constrain oil shipments through the Strait of Hormuz this quarter, and hopes for a negotiated reopening rose and faded more than once. West Texas Intermediate crude climbed from $70.56 a barrel on June 30 to $97.18 at quarter-end, a gain of roughly 38%, after trading as high as $107 during the quarter.
Those costs flow directly into consumer prices. The Consumer Price Index rose 3.4% over the 12 months through August, with the energy component up 16.3%, and gasoline alone accounted for more than a third of August’s monthly increase according to the Bureau of Labor Statistics. The Fed’s preferred gauge tells a similar story. The PCE price index rose 3.4% over the 12 months through August, but only 3.0% once food and energy are stripped out, according to the Bureau of Economic Analysis (BEA). Chair Warsh was candid about the limits of the Fed’s tools. The Fed “cannot affect any individual price, whether it be oil prices,” he said, but it can work to ensure that such price changes “don’t broaden out” into the rest of the economy.
The rest of the economy, meanwhile, keeps surprising on the strong side, with the notable exception of hiring. Nonfarm payrolls rose by just 29,000 in September, after a gain of 133,000 in August, and the unemployment rate ticked up to 4.2%. The BEA also revised second-quarter growth in real gross domestic product (GDP) up to a 2.2% annual rate from 1.5%, with consumer spending and business investment together growing at a 4.6% pace.
The flip side of expensive oil is that one company’s cost is another’s revenue. Energy was the best performing sector in the S&P 500 this quarter. The State Street Energy Select Sector SPDR (XLE) returned almost 16%, and FactSet expects the Energy sector’s third-quarter earnings to more than double from a year ago. Looking ahead, the US Energy Information Administration’s September outlook assumes shipments through Hormuz will gradually increase, with Brent crude averaging about $91 per barrel this year and $74 in 2027. Of course, any forecasts tied to geopolitical events should be viewed skeptically. If oil prices buck expectations and stay elevated, we suspect inflation will prove sticky and the Fed will remain vigilant.
Market Outlook
We see three themes as most likely to shape markets over the coming months.
Earnings versus rates. Third-quarter reporting season begins in earnest in mid-October. With estimates rising rather than falling during the quarter, the hurdle for positive surprises is higher than usual. We think it is more likely than not that earnings remain strong enough to offset much of the pull from higher yields, but we would not be surprised by further volatility if the 10-year yield continues to climb.
The Fed’s next move. The FOMC meets on October 27–28 and again on December 8–9. Fed officials’ own projections point to one more quarter-point increase this year, while Chair Warsh has declined to offer guidance. We suspect the path of energy prices and the broader trend in inflation will matter more to the outcome than any single speech or data point.
Midterm musings. Voters head to the polls on November 3, with control of both chambers of Congress at stake. According to the Schwab Center for Financial Research, the S&P 500 has averaged a price gain of just 1.7% from August 1 through Election Day in midterm years since 1974, followed by average gains of 5.7% over the next three months and 12.4% over the next six months. It is worth noting that the sample size is small (13 elections), and past patterns are no guarantee of the future. That said, we believe it reflects the market’s tendency to react positively to resolution of political uncertainty.
Fourth Quarter Watchlist
Over our 30-plus years in this business, we have learned that investors do best when they respect gravity without being paralyzed by it. Rising profits and rising rates have coexisted before, and we have found that patience and a steady focus on quality serve investors well through such periods. As always, we invest alongside our clients with a long-term mindset. We appreciate the trust you place in JAG, and we wish you and yours a wonderful autumn.
Best,
Norm Conley
CEO, Chief Investment Officer & Portfolio Manager
View Full Commentary as PDF
Disclosures
These comments were prepared by the staff of JAG Capital Management, LLC, an SEC-registered investment adviser. The information herein was obtained from various sources including but not limited to FactSet, Bloomberg, Reuters, Standard & Poor’s, Claude, ChatGPT, and the United States Bureau of Labor Statistics, and believed to be reliable; however, we do not guarantee its accuracy or completeness. The information in this report is given as of the date indicated. We assume no obligation to update this information, or to advise on further developments relating to markets, trends, or securities discussed in this report. Opinions expressed are those of the adviser listed above as of the date of this report and are subject to change without notice. Opinions of individual representatives may not be those of the Firm. Additional information is available upon request.
The information contained in this document is prepared and circulated for general information only. It does not address specific investment objectives, or the financial situation and the particular needs of any recipient. Investors should not attempt to make investment decisions solely based on the information contained in this communication as it does not offer enough information to make such decisions and may not be suitable for your personal financial circumstances. You should consult with your financial professional prior to making such decisions. For institutional investors: JAG Capital Management, LLC, has a reasonable basis to believe that you are capable of evaluating investment risks independently, both in general and with regard to particular transactions or strategies. For institutions who disagree with this statement, please contact us immediately.
Past performance should not be considered indicative of future performance. Any investment contains risk including the risk of total loss.
This document does not constitute an offer, or an invitation to make an offer, to buy or sell any securities discussed herein. J.A. Glynn & Co., JAG Capital Management, LLC, and its affiliates, directors, officers, employees, employee benefit programs, and discretionary client accounts may have a position in any securities listed herein.
Please let us know if your financial situation or investment objectives have changed, or whether you prefer to place any reasonable restrictions on the management of your account(s) or modify any existing restrictions.
About JAG
JAG Capital Management (JAG) actively invests for institutions and individuals in highly selective, customizable, and nimble equity and fixed income strategies. JAG is a boutique, independent, employee-owned investment management firm in St. Louis.
1610 Des Peres Road, Suite 120, St. Louis, MO 63131