

The blue line in the chart below shows the drawdown in the S&P 500 from its trailing 12-month high. The red line shows the percent increase in the ratio between the yield on Moody’s BAA bond index and the 10-year Treasury yield from its trailing 12-month low. The ratio sounds complicated, but the interpretation is straightforward. Fixed income investors have often been sensitive barometers of anxiety in financial markets. Increased concern often leads to rising yields on corporate debt vs. risk-free Treasury bonds. This chart captures those changes by plotting changes in the ratio of BAA rated debt vs. 10-year Treasury debt. Rising fear will cause the red line to rise.
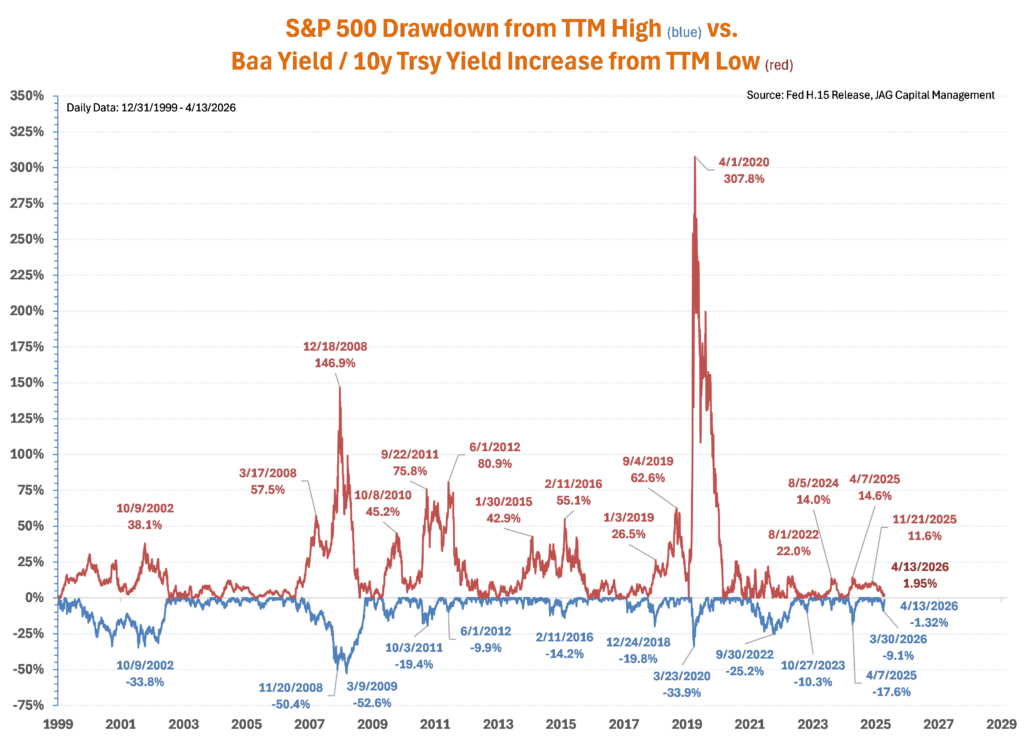
Looking at the chart, we see that drawdowns in stock prices often coincide with increases in the BAA/10y ratio. The relationship is not perfect, but it does provide some indication about the level of fear among investors broadly speaking. Major events like the Great Financial Crisis in 2008-2009 and the brief, but violent reaction to Covid in March of 2020 resulted in sharply wider credit spreads and painful drawdowns in stock prices.
Which brings us to something we found noteworthy about recent events. The war with Iran has roiled a wide range of commodity markets from oil and LNG to helium and fertilizer. Prices for crucial raw materials have risen sharply squeezing businesses and consumers across the world. Despite these disruptions the level of concern in fixed income as measured by the BAA yield/10-year Treasury yield ratio is essentially zero. The fact that fixed income displayed essentially no fear provided valuable insight into the attitude of domestic financial markets in general. The S&P 500 did experience some moderate pain falling as much as 9.1% from its trailing twelve-month high but has rebounded sharply in recent days.
Events are still unfolding but at this point US financial markets have decided to look past the war with Iran.
Source: Fed H.15 Release, JAG Capital Management Research