Cable and satellite providers are losing the cord-cutting battle. Is the trend here to stay?
Why pay $100-$200/month for hundreds of channels that you never watch? More consumers are answering this question by choosing to cut the cord and walk away from their cable and satellite subscriptions.
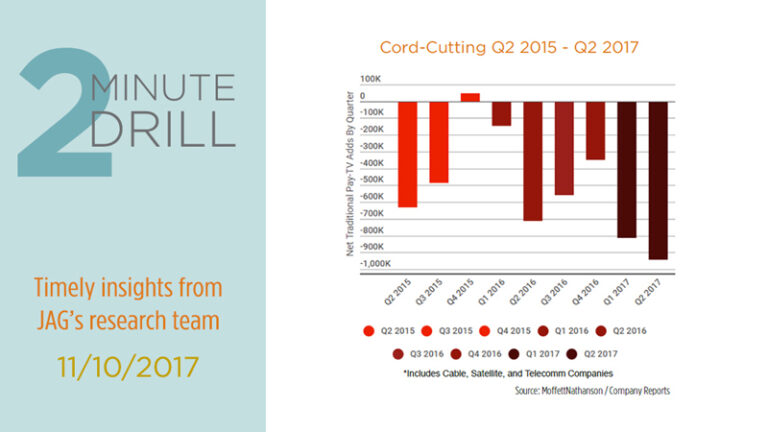
In fact, during just the 2nd quarter of 2017, almost 1 million terminated their subscriptions. Cord-cutting is accelerating among U.S. cable and satellite subscribers as the quality and quantity of streaming content expands.
The primary winners here are consumers, who can easily subscribe to 3 high-quality, content-rich streaming services for less than $50/month. The losers are the incumbent cable and satellite providers, along with content companies who distribute their content through traditional cable channel “bundles.”

This trend towards “Over the Top” streaming services has been in place for several years now. Traditional video subscribers have been migrating away since 2013. By 2018, UBS estimates that total U.S. video subscribers will decline to 92.1 million, an 11% drop from the 103.1 million subscribers from 2012.

Demographic data indicate that the cord-cutting trend is probably here to stay. While 88% of adults aged 68+ have either a cable or satellite TV subscription, only 62% of 18-36 year-old adults are traditional video subscribers. Cable and satellite companies will need to get quite innovative to keep younger subscribers on board. The problem is, almost anything they could do would be likely to compress revenue and margins, particularly if they choose to compete with the streamers on price.

Here we examine a few custom baskets of media and advertising stocks and their performance since 12/31/14. There have been selective winners in the Broadcast4, Cable4, and Movie5 portfolios over the past three years, but overall these group’s cumulative performance has been well short of the 42.7% gain for the Russell 1000 Growth over the same period. The major Advertising firms highlighted in the Ad3 group have delivered dismal returns over both periods. And none of the stocks in these groups have posted positive returns compared to the Russell index so far in 2017. The Live2 + SNE group, on the other hand, has been stellar. This group contains the leading live entertainment companies (LYV and MSG), the leading streaming content provider (NFLX), and a major global player in home entertainment (SNE). We think bottom-fishing in the traditional media and advertising companies is becoming an increasingly dangerous game.
