Roses and Thorns in Semiconductors?


The current broad-based stock correction began in late September and has lopped roughly 10% off the major stock indices over the last 7 weeks. But the bear market in semiconductor-related stocks began much earlier. Through the end of October 2018, the Bloomberg Semiconductor Index (i.e. chip makers) had fallen by 7.1% for the year, lagging the Russell 1000 Growth Index by over 900bps. Over the same time period, the Semiconductor Equipment Index (i.e. the chip equipment manufacturers) got smacked down by an almost 30% drawdown.

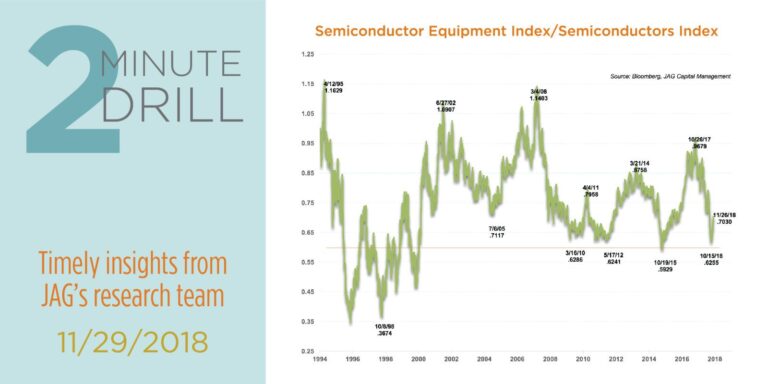
Although both groups of companies’ fortunes are linked to global chip pricing trends, they tend to exhibit divergent performance depending upon where we are in the cycle. When the blue line is falling, the chip makers are outperforming the chip equipment makers. When the blue line is rising, the equipment companies are leading the charge. At times, the delta between the absolute and relative performance of the two indexes can be stark. For example, as the data in the table indicates, the Semiconductor Index vastly outperformed both the Russell 1000 Growth and the Semiconductor Equipment Index between March 2014 and October 2015. But the Equipment Index exploded for a 160%+ gain between October 2015 and October 2017, leaving both the chip companies and the broader market far behind.

There are tentative technical signs that another up-cycle in absolute and relative performance could be at hand for the Semiconductor Equipment Index. We note that so far in November, the Semiconductor Equipment Index has generated double-digit gains, compared to veritable flat-line performances by the Russell and the Semiconductor indices. Skeptics might be inclined to call this a “dead cat bounce,” and they could be right. Thy might correctly point out that the global semiconductor industry seems to be entering a soft patch, driven by supply gluts and poor price/margin dynamics for many of the more commoditized chip categories like NAND and DRAM. Bears might also note that semiconductor companies manufacture and sell their products through global supply chains, many of which wind through China. This arguably makes the entire industry more susceptible to trade tensions and tariffs. We agree with all these observations, but we have learned from hard experience that cyclical stocks tend to build bottoms in the midst of poor fundamental news flow. By the time fundamentals are demonstrably more favorable, the upside investment opportunities are greatly diminished. We are not calling the bottom (yet), but we like the odds that select chip equipment makers could be an attractive source of alpha into 2019.

Important Notice

This document contains investment performance information and is intended solely for Institutional Investors and Financial Intermediaries.

By clicking "Accept" below, you confirm that you are:

This material is not intended for retail investors and should not be distributed or relied upon by any person other than the intended audience. Performance data presented may be based on past results, which do not guarantee future performance.

If you do not meet the qualifications above, please click "Decline" to return to the homepage.

eMoney

eMoney is an industry-leading financial planning platform designed to help advisors, planners, and RIAs deliver personalized, comprehensive financial advice to clients across all stages of life.

Nitrogen

Nitrogen is a client-engagement and advisor platform built to bring clarity, quantification, and alignment to risk tolerance and portfolio construction. It uses a proprietary system that simplifies risk into a single, objective metric — the Risk Number® — allowing advisors and clients to speak the same language about risk, rather than relying on vague, subjective labels like “moderate” or “aggressive.”

Important Notice

This document contains investment performance information and is intended solely for Institutional Investors and Financial Intermediaries.

By clicking "Accept" below, you confirm that you are:

This material is not intended for retail investors and should not be distributed or relied upon by any person other than the intended audience. Performance data presented may be based on past results, which do not guarantee future performance.

If you do not meet the qualifications above, please click "Decline" to return to the homepage.

You are now leaving

www.jagcap.com