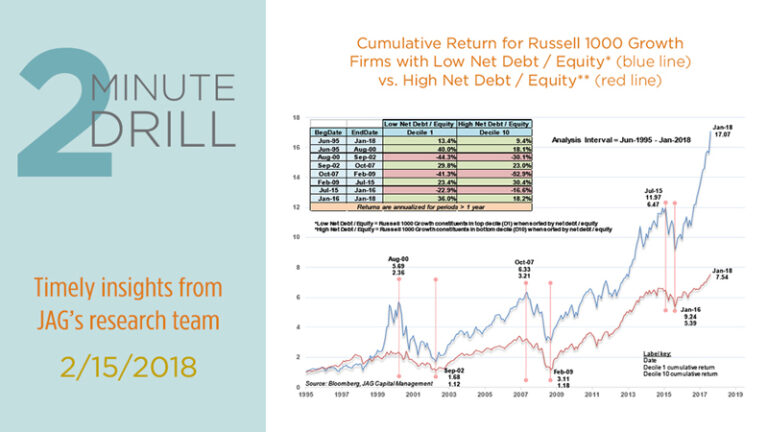
Debt may not be the root of all evil, but high debt levels definitely appear to be an enemy of growth stock performance. As we show in this chart, low debt growth companies have generated dramatically better cumulative returns than those with the highest debt loads since 1995. Low debt growth stocks have annualized 17.1% returns over the past 23 years, compared with only 7.5% for their high debt peers. In fact, low debt stocks have outperformed high debt stocks in 19 of the last 23 years, which works out to an 83% beat rate. Why is this happening? Part of it is due to their respective earnings growth rates. In short, low debt companies simply grow faster. Over the past decade, the median long-term EPS growth rate for low debt companies has been 16%, compared to less than 11% for high debt companies.

Low debt companies are also being afforded higher P/E multiples by the market, especially since 2012. This is somewhat counterintuitive given the fact interest rates have been generally low or declining for most of the past six years. The market appears to “know” that interest rates will eventually increase for heavily debt-laden companies, thus driving up their expenses and compressing their margins. Our research leads us to the conclusion that markets pay more for “quality” as measured by low debt/equity ratios, and that the premium for quality is increasing in recent years.

This has certainly been a historically convulsive time in the equity markets. This chart plots the ratio between the S&P 500 P/E ratio and the VIX volatility index. When the blue line is going up, volatility is declining faster than the earnings multiples. The February explosion in the VIX has quickly taken this ratio back to levels that have indicated near/intermediate-term bottoms for the stock market corrections. Those looking for ways to capitalize on a rebound for stocks might want to look at the Financials, Consumer Discretionary, and Technology sectors. Those three groups have generated the best 1-year returns following previous volatility shocks since 2001.

The Energy sector continues to be a very difficult area for investors. Compared to the Russell 1000 Growth Index, the ETF tracking the Energy sector hit a 4,022 trading-day low on February 9. This implies that the relative performance of Energy stocks is worse than it has been in roughly 16 years! It is certainly possible that there are great long-term values in this group, but we remain unenthused. We are concerned that expanding U.S. shale production, combined with the advent of cheaper alternative energy sources and slower global demand growth could put a cap on oil prices – and energy stocks – for the foreseeable future.
