Using multiple metrics, JAG assesses current stock market valuation.
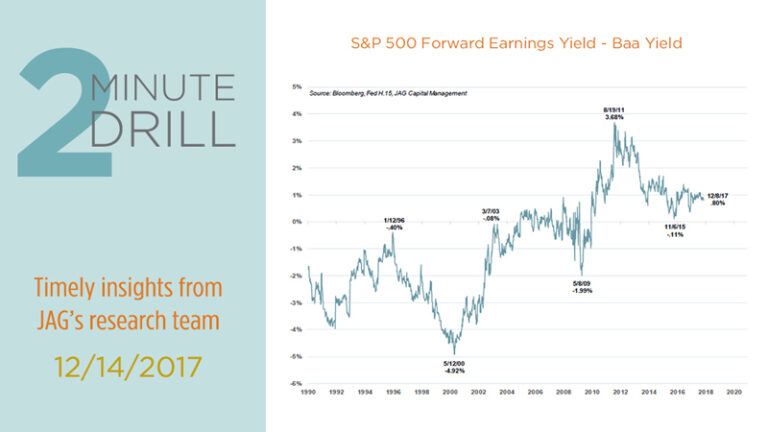
After a long bull market and a great 2017, there are lots of smart people who think the stock market is expensive. However, as experienced investors know, securities valuation is always a tricky business. A popular valuation metric is the P/E ratio, which simply divides share price by earnings per share. We favor the inverse of the P/E ratio (E/P), because it allows us to calculate an earnings yield. Unlike P/E’s, earnings yields can be compared to fixed income yields, thereby giving us the ability to compare stock and bond valuations. The S&P 500’s forward Earnings Yield is currently 5.05%, which is .8% higher than BAA-rated corporate bonds. This chart shows the spread between these two yields. When the blue line is higher than 0%, the S&P 500’s earnings yield is higher than BAA bond yields. As we can see, stocks were much cheaper in 2011 than they are today. That said, by this same measure, the S&P 500 spent almost the entire 1990s at a much higher relative valuation than it does currently.

The Fed Model compares the stock market’s earnings yield to the government bond yields. Originally named by investment strategist Ed Yardeni, the Fed Model has been used by the Fed as a simple way to gauge the relative attractiveness of equity and fixed income assets. This chart uses the Fed Model to plot the spread between the S&P 500’s forward earnings yield and the 10-year U.S. Treasury bonds yield. Although it uses government-backed bonds rather than corporate bond yields, it tells a similar story about current stock market valuation. While stocks were much cheaper in 2008 and 2011 than they are in late 2017, they were priced much more richly in the 1990’s than they are today. While this data does not mean that equities are classically cheap as we enter 2018, we think it supports the view that stocks appear to be reasonably valued – at least when compared to longer-term bonds.

Here we take the earnings yield analysis down to the sector level. The Financials sector’s forward twelve-month earnings yield of 6.5% looks particularly juicy, while the Energy sector brings up the rear among the major equity sectors. The Consumer Discretionary and Consumer Staples sectors also look a bit rich compared to the other sectors. Of course, astute observers will note that this data is based upon estimated earnings. If estimated earnings lag actual reported earnings in 2018, it is likely returns will be lower than expected. Of course, the inverse is also true. If earnings exceed estimates (again) next year, stocks could be expected to generate decent returns. All else being equal, our short-hand view of this data makes us more inclined to hunt for good ideas in the Financials sector, while being a bit more cautious on the prospects for consumer-oriented stocks.

Another way to look at a stock’s value is to compare the P/E ratio to its growth rate, which results in a PEG ratio. This helps answer the question of how much investors are paying for a given amount of earnings growth. High PEG ratios are generally considered to imply high valuations. Here we can see that the Consumer Discretionary, Consumer Staples, Industrials, and Utilities sectors all sport PEG ratios of greater than 2x. Many individual stocks in these groups pay competitive dividends and have a reputation of being high quality “blue chips.” Broadly speaking, it seems to us that investors may be over-paying for high quality and dividend-paying stocks, which could create an opportunity for investors who favor companies with faster top- and bottom-line growth prospects.
