Is there a resurgence in value stocks on the horizon?
So far this year, the Russell 1000 Growth Index has more than tripled the return of the Russell 1000 Value Index. (26% vs. 8%, year-to-date through 11/14/17, respectively). Given this vast recent outperformance by growth stocks, some Wall Street strategists are predicting that the worm will turn in 2018. They think that mean reversion will come to the rescue of value stocks, which could lead to value outperforming growth over the coming year.
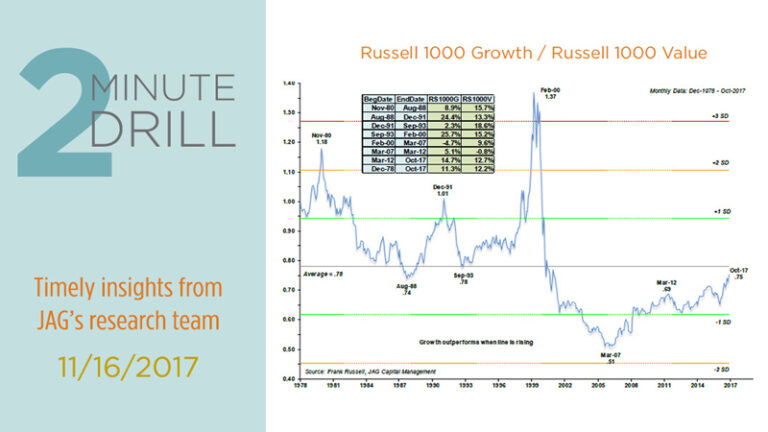
Anything is possible, but we would not bet the farm on a resurgence in value performance anytime soon. As this graph shows, growth dramatically outperformed value between September 1993 and early 2000. Then the bursting of the Internet bubble kicked off a long slide in growth relative performance that finally bottomed in early 2007. Over the last 10.5 years since then, growth has been slowly gaining ground. Despite that fact, the relative performance of the Russell 1000 Growth Index is only now approaching the long-term average (.78, which is represented by the horizontal line on the graph). This implies that growth could continue to hold the performance crown until it approaches previous historical relative performance peaks (November 1980, December 1991, February 2000).

Courtesy of data compiled by Professor Kenneth French, here we see the relationship between big growth and value stocks all the way back to 1926. As you can see, Growth generally lagged Value between August 1939 and March 1989 (50 years!). Is it any wonder that the notion that “value stocks always outperform in the long term” long ago became an article of faith among investors?
Something – we are not sure what – clearly changed the relationship between growth and value in the late 1980’s. As the chart shows, value has been much less dominant as an investment style since 1989. Was this due to the advent of powerful and cheap computing technology, which gained broad adoption at roughly the same time? Or perhaps could it have been the change in direction of interest rates (from rising to falling) after the Volcker Fed? Again, we are not sure.
Notice how one must squint to discern the most-recent period of growth outperformance on this chart. Also note that this year’s spike in growth’s relative performance remains well below previous peaks that have occurred over the past several decades (i.e. 7/72, 2/00, 2/09). From a technical perspective, it is worth considering the possibility that growth stocks could continue to gain relative strength for several more years before approaching any of the previous peaks. In other words, growth might have plenty of runway left in terms of both time and price. Time will tell!
